| |
|
|
|
|
|
|
|
 |
 |
 |
 |
 |
 |
 |
| |
|
|
|
|
|
|
DRAFT
|
| RESOURCES
|
| |
|
| Ontology Summit
2008 |
|
| Information scientists have
agreed on a "concept bank" programmers which could
use to build an Internet facility called the Open Ontology
Repository (OOR). The OOR would comprise diverse collections
of concepts (ontologies) such as dictionaries, compendiums
of medical terminology, and classifications of products, that
could be stored, retrieved, and connected to various bodies
of information.
Matthew
West (Shell International Petroleum), a member of the
advisory committee, is currently developing Shell’s
Global Downstream Data Model.
CEE might consider getting involved in this effort while defining
the structure of information for their Energy Literacy site.
|
|
| TheBrain.com |
|
|
|
|
| Concept Maps |
|
. |
| |
|
| NVAC:
National Visualization & Analytics Center |
|
| NVAC™ provides strategic
leadership and coordination for visual analytics technology
and tools. It was chartered by the U.S. Department of Homeland
Security in 2004. NVAC's R&D agenda for visual analytics
to facilitate advanced analytical insight is detailed in a
book and video. |
 |
Illuminating
the Path: The Research and Development Agenda for Visual Analytics
|
|
|
| NETL: National Energy Technology Laboratory |
|
|
NETL's Visualization
Lab has a dedicated team to assist scientists in their visualization
needs. Support can range from writing custom reader modules
for visualization applications to helping users operate one
of the display systems in the lab. |
|
|
|
|
| InfoVis Wiki |
|
 |
Courses/Podcasts
Graphic
Gems
Commercial
Visualization Software
|
|
IEA: International Energy Agency
|
|
| The International Energy Agency (IEA)
acts as energy policy advisor to 27 member countries in their
effort to ensure reliable, affordable and clean energy for their
citizens. Its mandate incorporate the “Three E’s”
of balanced energy policy making: |
|
energy security, economic development and environmental
protection. Current work focuses on climate change policies,
market reform, energy technology collaboration and outreach
to the rest of the world. |
|
|
DOE: US Department of Energy
|
|
 |
The Energy Information Administration
of the U.S. Department of Energy, provides statistics on domestic
and international energy |
|
|
| NPC: National Petroleum Council
|
|
|
The National Petroleum Council (NPC) was established in
1946 as a federally chartered and privately funded committee.
Its purpose is solely to represent the views of the oil and
natural gas industries in advising, informing, and making
recommendations to the Secretary of Energy with respect to
any matter relating to oil and natural gas, or to the oil
and gas industries submitted to it or approved by the Secretary.
|
 |
Hard
Truths is NPC's comprehensive view to 2030 of global oil
and natural gas, developing a framework in which to consider
America’s oil and natural gas position now and for the
future. (Slide
Presentation) |
|
|
| NBER: National Bureau of Economic Research |
|
| Founded in 1920, the National Bureau
of Economic Research is a private, nonprofit, nonpartisan research
organization dedicated to promoting a greater understanding
of how the economy works. The NBER is committed to undertaking
and disseminating unbiased economic research among public policymakers,
business professionals, and the academic community. |
| NBER
Papers in Environmental and Energy Economics |
Environmental
and Energy Economics
|
This program studies all aspects
of the energy sector and the environment, focusing particularly
on their interdependence. Topics include non-energy environmental
and natural resource issues, but particular attention is paid
to policies that affect all sources of energy, due to that sector's
role in national security and as a primary emitter of local,
regional, and global pollutants.
|
|
|
| RMI - Rocky Mountain Institute |
|
| Rocky Mountain Institute (RMI) is
an independent, entrepreneurial, nonprofit organization dedicated
to fostering efficient and restorative use of resources to make
the world secure, just, prosperous, and life-sustaining. |
 |
RMI's Winning the
Oil Endgame offers a strategy for ending US oil dependence
led by business for profit.
(Video
Podcast)
|
|
|
| Public Agenda |
|

A nonpartisan opinion research and civic engagement organization
helping Americans explore and understand critical issues since
1975.
|
 |
Putting
the Pieces Together: How Do Citizens and Experts
See the Energy Issue?
A Report for the Kettering Foundation from Public Agenda
Will Friedman, McKenna Morrigan and Alison Kadlec, February
2008 |
| |
PRESIDENTIAL CANDIDATES
Energy Positions
|
|
|
OTHER ENERGY
LITERACY SITES |
| Energy
Literacy Advocates (ELA) is a non-partisan, non-profit,
public education and advocacy group. Our mission is to improve
the energy literacy of all sectors of our democracy in order
to empower and sustain a responsible, comprehensive national
energy policy. |
BP
Statistical Review of World Energy June 2007 - Energy Charting
Tool
.Cambridge Energy Research Associates,
Inc. (CERA) is a leading advisor to international energy
companies, governments, financial institutions, and technology
providers. CERA delivers critical knowledge and independent
analysis on energy markets, geopolitics, industry trends, and
strategy.
|

IEEE - Power/Energy Website
"The worlds' leading source of technology news and anlysis."
|
|

|
VISUALIZING
ENERGY LITERACY
Energy statistics abound. Public
understanding does not. Bridging the gap requires taking into
account what people want to know
about energy and using that as an entry point to insert what
they need to know
to make informed decisions affecting, not just what it costs
to fill up our gas tanks today, but what policies are required
for energy security and economic stability tomorrow.
Visualization can play a role in
public education. Much work has been done over the last decade
to improve technical capabilities in this area. The public
is gradually becoming acclimated to sophisticated graphic
presentations in the media and on the internet. Business'
appetite for graphic presentation of metrics has spawned elaborate,
if not always effective, dashboards. What we will try to investigate
here are not dashboards, but storyboards to provide information
in a manner that is not only accurate and easy to digest,
but appealing enough to be selected from the ever growing
menu of multimedia choices competing for the public's attention. |
CONTEXT
In telling any story, it is important to set
the stage. There are many sources of rich of statistics and
graphics on energy that can be drawn upon for this purpose.
{See examples below.]
|
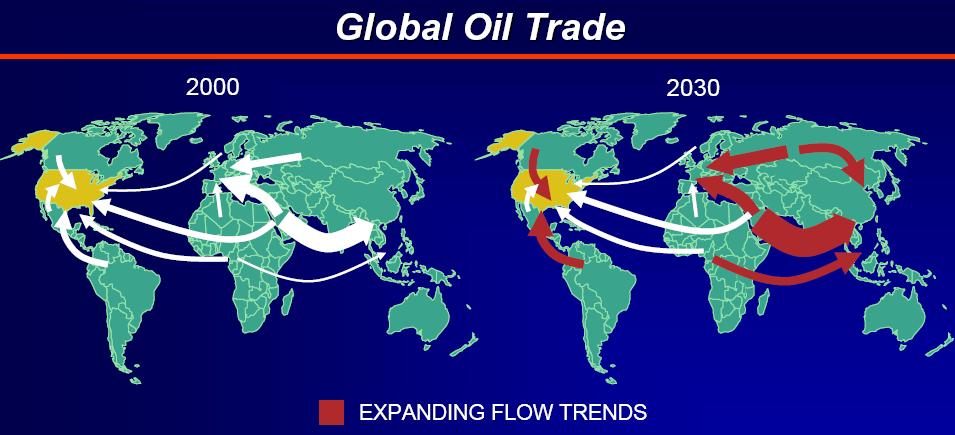
SOURCE: NPC, Hard Truths, Slide 27
Visitors to an Energy Literacy website
could use such a map as a "drilling platform" from
which to access an underlying database of energy information.
Depending on the information accessed, visual representations
could be overlayed on a physical map, a timeline, a concept
map, or presented in a more traditional chart, but one using
more effective technology such as Trendalyzer (should it reemerge
from Google's skunkworks). Glyphs could be used to encapsulate
multiple attributes in a two dimensional space. Below is an
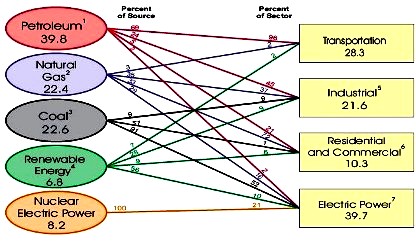
example . The first graph is a visual from a DOE report. It
provides little information that could be presented more clearly
in a standard input output table.
U.S. Primary Energy
Consumption by Source and Sector, 2006 |
(Quadrillion
Btu) |
| |
Transportation |
Industrial |
Residential
&
Commercial |
Electric
Power |
Total
|
| Petroleum |
27.5 |
9.6 |
2.0 |
0.8 |
39.8 |
| Natural Gas |
0.7 |
7.8 |
7.4 |
6.5 |
22.4 |
| Coal |
0.0 |
2.0 |
0.0 |
20.6 |
22.6 |
| Renewable Energy |
0.5 |
1.9 |
0.6 |
3.8 |
6.8 |
| Nuclear Electric Power |
0.0 |
0.0 |
0.0 |
8.2 |
8.2 |
| Total |
28.6 |
21.3 |
10.0 |
39.9 |
99.8 |
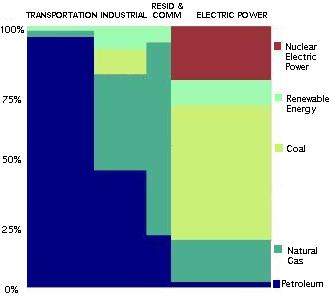
The second graph visualizes the same data in
a manner that shows the input output relationship of each
pairing of an energy source and use. The sources are color
coded—blue for Petroleum, red for Nuclear, etc. The
box is divided vertically and proportionally according to
use by the Transportation, Industrial, Residential & Consumer,
and Electric Power sectors. Within each sector's column, the
height of a color or type of energy represents its contribution
to the sector while the width of the column represents the
sector's relative size.
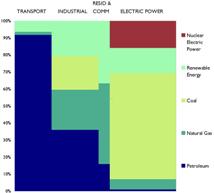
Once a glyph is understood, it's
visual signature can be compared over time or over regions.
While each glyph or box is divided up proportionately according
to sources and uses, the overall size of each glyph can be
tied to actual totals. For instance, the box above represents
99.8 quadrillion btu's used in 2006. The boxes below are proportionally
smaller, representing roughly half and two-thirds the overall
use displayed in the first glyph. The color "signatures"
also indicate different relative sources and sector sizes.
Country or regional glyphs can be arrayed on
a map, providing comparable energy information within a geographic
context.
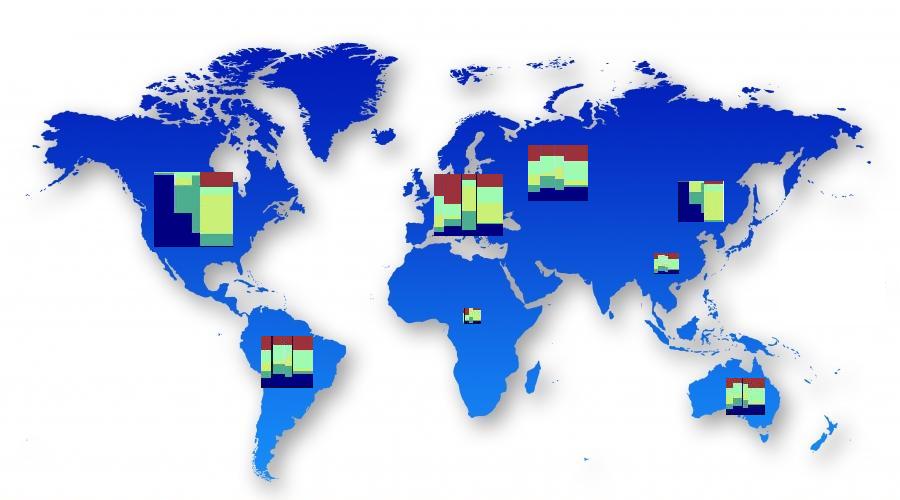
The map and glyphs could also serve as a portal to county
or region specific information sources.
|
TRANSMISSION
All the oil in Saudi Arabia would
be of little value if there were no means of delivering it
to heat homes, fuel cars, or power factories. Similarly, a
presentation is not effective unless its message can be transmitted
and received. Any broadbased literacy program will need to
take into account where people go for their information and
how they retrieve it. This could include, among other targeted
efforts:
- a Press Release program for traditional print
media such as community newspapers and
- either direct management of a proprietary,
controlled contribution Energy Wiki
- or proactive placement of links in, contributions
to, and correction of material in Wikipedia
itself.
|
|
Access to the K-12 arena is more problematic given the crush
of requirements with which teachers are faced. However, it
may be possible to insert high quality materials that help
educators satisfy these requirements through the burgeoning
homeschool market and through programs such as the Verizon
Foundation's Thinkfinity,
an online lesson plan resource. Energy content to this site
was supplied by the National
Geographic Education Foundation, the American Association
for the Advancement of Science / Science
Net Links, and the National Council on Economic Education's
EconEdLink. Note
that content providers must meet rigorous requirements.
Another model for this type of effort is the collaboration
between the Stanford
Solar Insitute and Local Schools. (See, A
Unique Collaboration Between Scientists and Educators)
Another potential course of action would be preparation and
free distribution over the internet of all materials necessary
for a course in Energy Literacy to be used, for instance,
in
- Service-Learning
- Continuing Education
- Community Colleges
- In-Service Programs for K-12 Teachers and
- School of Education Methods Courses for pre-service
teachers
All materials would start from the perspective of consumers'
immediate, personal concerns, and evolve organically like
Mind Maps
generating a better understanding of the long term implications
of global supply and demand relationships and the role individuals
play in them. Preparation of the materials might be done with
a partner such as the Center
for Science and Mathematics Education at The University
of Texas at Austin, a research, teaching, and service unit
located in the College of Education or with a similar group
devoted to Social Studies Education. This effort should be
accompanied by a training program for course providers. Developing
it within a College of Education and for a Methods Course
would serve multipe goals of development, educatior preparation,
and school insertion.
It also would be helpful to identify associations and organizations
which would
- encourage members to provide the Energy Literacy course
as a community service as well as
- offer course instructor preparation during the course
of their normal meetings or conferences.
It would wise to structure this effort to reflect the service
or continued learning requirements of partner associations
which might include the following:
- International Association for Energy Economics (IAEE)
- National Youth Leadership Council (NYLC),
- Federal Reserve Bank Branche education offices (FRED)
- National Association for Business Economics (NABE)
- Society of Financial Analysts(SFA)
| INTERNATIONAL ASSOCIATION
FOR ENERGY ECONOMICS |
NATIONAL YOUTH
LEADERSHIP COUNCIL |
FEDERAL
RESERVE EDUCATION |
NATIONAL ASSOCIATION
FOR BUSINESS ECONOMICS |
SOCIETY OF FINANCIAL
ANALYSTS |
|
|
|
|
|
Other potential partners would include high
tech companies with strong track records in democratizing
visualization such as Google (Earth) and IBM (Many Eyes).
GOOGLE
EARTH
 |
|
MANY
EYES
 |
The National Laboratories may also provide
partnering opportunites for education initiatives involving
energy and visualization, particularly
- PNNL, Pacific Northwest
National Laboratory, home to
NVAC, the National Visualization and Analytics Center
- NETL, the National
Energy Technology Laborator, which also houses a
Visualization Lab and
- NREL, the National
Renewable Energy Laboratory

NREL promotes excellence in teaching
and learning and contributes to improving critical elements
of the science, mathematics, and technology education system.
Teachers are offered research and development opportunities
to enhance their content knowledge, instructional strategies,
and leadership abilities. |
|
| Visualizations run the gamut from
simple bar charts to fully interactive 3-D applications. It
may appear that younger audiences require "glitzier"
presentations, however, content is still key for .holding their
attention. Depth and drilldown capability, complexity with clarity,
and a good storyline are necessary elements for students with
plenty of other attention grabbing options. On the high end
of content and complexity, see for instance the online version
of the New York Metropolitan Museum of Art exhibit Design
and the Elastic Mind. The computer interface will likely
delight the MP3 generation and quickly confound or frustrate
their parental units. Try typing in "ENERGY" in the
Search Box - finding which may require patience, bifocals, or
both. You are on your own in learning to navigate the links,
a task with which a pre-would have no difficulty. |
| |

Emergent
Surface, a dynamic architectural facade which responds to
people's movements and exterior weather changes - From MOMA's
exhibit, Design
and the Elastic Mind. |
| |
| On the other end of the technical
spectrum of visualization tools for energy literacy are "Concept
Maps" which require only paper, pencil, and a vivid imagination
to help a child to develop their own storyline. A wonderful
collection
of Energy concept maps was produced by science/medical writing
students at the University of Kansa one of which is shown below. |
|
|
OTHER ENERGY
VISUALIZATION EXAMPLES |
|
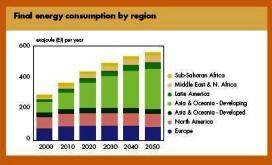
| ENERGY BAR CHARTS |
| FINAL CONSUMPTION BY REGION |
|
PRIMARY ENERGY BY SOURCE |
 |
|
|
|
|
|
|
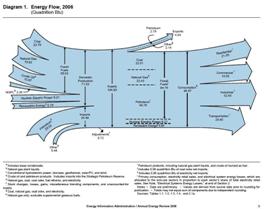
U.S. ENERGY FLOW - STATIC |
|
U.S. ENERGY FLOW - COMPARATIVE
STATICS |
 |
|
|
| SOURCE: DOE,
Annual Energy Review, 2006 |
|
|
|
|
|
| DYNAMIC ILLUSTRATION OF FRACTIONAL DISTILLATION
-- click on image to demonstrate |
|
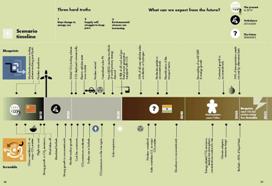
TIMELINES & SCENARIOS |
 |
|
 |
| SOURCE:
How Stuff Works |
|
SOURCE: Shell
Energy Scenarios to 2050 |
| |
|
|
ENERGY
FOOTPRINTS: WALKING THROUGH THE ENERGY SECTOR
OF AN INPUT OUPUT MODEL
|
| This simple interview shows
the power of storytelling in explaining the pervasiveness
of carbon footprints in our daily lives. It is also an interesting
way of introducing the concept of the energy sector in an
economic input-output model without ever mentioning any of
those user-unfriendly words. This sort of video could be used
to prime participants to create a map of energy use in their
own lives, to think beyond the gas pump and heating oil tank
to the energy components of their food and clothing and their
entertainment, and work habits. An activity might include
one like listing all the points at which energy enters a glass
of wine (of milk) that we drink, starting with the sun that
makes the grapes or grass grow, the electricity that runs
the processing equipment, including production of the containers
to hold the liquids, and the fuel to deliver it to the store,
to drive to pick it up, and to bring that fuel from its source
through refining and to the pump. It could be a very large
energy map indeed..
|
| |
|
|
|
| |
|
|
|

|

|

|

|

|

|
| |
| Contact Information:
Email: info@inkweb.org

RETURN TO TOP
|
|