|
GENERAL REFERENCE
Search Engines: Google -
WolframAlpha -
Powerset Search Tool -
News: Arts&Letters -
CEO Express -
Reference: Dictionary -
WordNet� -
Wikipedia -
Library - CIA
World Factbook - Humanities
& Social Science Journals - Maps -
File Conversion -
Language
Translation - Books -
U.S. Government - Look
Up: Zip Codes -
Postal
Rates - Area Codes
I - Area Codes II
- Telephone Numbers -
People - Health:
Health - Mayo
Clinic/Fitness - Harvard/Nutrition -
Nutrition
and Diet Tools - Pritikin Healthy Kids Guide - Calendar -
Weather - Time -
Entertainment: Songs -
Movies
Imdb - Free Movies -
YouTube -
Travel: Traffic -
Travel Planning -
Flight
Status - Airport
Delays
FREE
WEB DESIGN TOOLS
Google
Interactive Charts (Visualization API) -
CSS Tutorials -
Developing
an iPhone App - Lightbox
PopUp Windows - Nettuts
Spoonfed Web Skills - Video
on the Web - Pattern
Browser - DimDim
Webcasting - MOODLE Course
Mgmt Software -WINK
Tutorial Software - Pixorial
Film Editing - Google
Visualization API - Color
Selector - Cube - Wheel - Visibone
Palette - Color
Blind Palettes - Your
Site as seen by the Color Blind Colors
As Seen by the Color Blind
CONTENT-RICH
PODCASTS/COURSEWARE
TED: Technology,
Entertainment & Design
MIT: OpenCourseWare
- Lecture Browser
- MIT World - Long
Now Fdtn - University
Channels -
NPR
Harvard: IIC:Initiative
in Innovative Computing
eLearning: Tech, Business,
& Design
Business Intelligence: B-Eye
Network
Languages: Live Mocha
GREENSPACE
Mother Earth News - TreeHugger:
How To Go Green - Sierra
Green Building Resources -
Barbara Kingsolver's
Animal, Vegetable, Miracle
Lessons
on Beauty in Nature:The Botany of Desire
 Sunflower
by Renata Scafuro, Bergamo, Italy Sunflower
by Renata Scafuro, Bergamo, Italy
The
simple beauty of a sunflower belies the sophisticated swirling pattern
in the arrangement
of its petals. For additional photos and information on Self-Organization
in Biological Systems, see Patterns
in Nature by Scott Camazine. Looking for Botanical Resource
Links? See the
Herbarium of Louisiana State University
Visualization Software: Mapping Tools in Overview
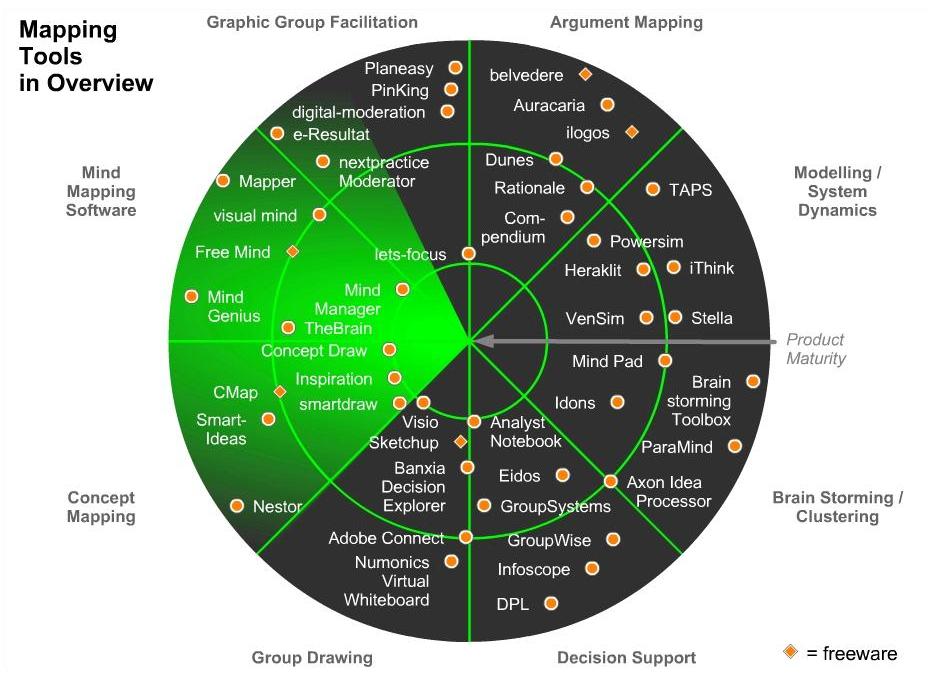
Map of Major Contributors to Visual Literacy Field
GRAPHIC GEMS
- Design
and the Elastic Mind
- US
Budget Chart
- York
Univ. Gallery of Data Visualization
- Death
and Taxes, 2010

Visible Human
Project
-Placing
History: Introducing geographic information systems in the context
of current humanities research
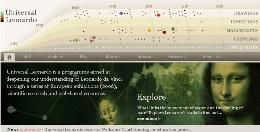 Universal
Leonardo Universal
Leonardo
-Picasso
web site
-Benjamin Edwards
-
Julie Mehretu
|
|
VISUAL ANALYTICS
Biological
evolution gave Homo sapiens a relatively large brain. Evolution
in communication methods and technology enhanced our ability to
store and analyze information. But paradigm shifts can confer and
rescind advantages based on the way in which individuals process
information. The shift in emphasis from
... spoken to written word - disadvantaged those deemed dyslexic
as well as the blind; for the latter, Braille and speech recognition
software provided some redress.
... printed word to digital data - created a new divide,
computer literacy; however, graphic user interfaces helped re-level
the playing field
... data to their inherent patterns - raised the premium
on visual literacy, the ability to perceive and analyze patterns.
Anecdotal evidence (see Negroponte and West below) suggests some
people whose brain structure places them at a disadvantage in terms
of reading may be better wired for visualization. For the rest there
is "visual analytics, a contemporary and proven approach
to combine the art of human intuition and the science of mathematical
deduction to directly perceive patterns and derive knowledge and
insight from them."
Pak Chung Wong and Jim Thomas, Pacific Northwest National Laboratory
The
tool set for 21st Century Skills now includes Visual
Literacy, "the ability to interpret, use, appreciate, and
create images and video using both conventional and 21st century
media in ways that advance thinking, decision making, communication,
and learning." North
Central Regional Educational Laboratory® (NCREL)
SYMPOSIUM
IEEE
Symposium on Visual Analytics Science and Technology (IEEE VAST)
-- the premier forum for data
and information visualization advances for academia, government,
and industry was held in October 2008. Many of the presentations
can be found on IEEE's Visualization
and Graphics Community site or visit the VisWeek
2008 or VisWeek2009
websites for complete program listing. Watch for information
on VisWeek 2010
to be held October 24 - 29, 2010, in Salt Lake City, Utah.
RESOURCES
|
| |
Overview
Three Special Events in the History of Technology
for Creating, Organizing, and Sharing Information
by C. Sidney Burrus, Richard Baraniuk
Illuminating
the Path: The Research and
Development Agenda for Visual Analytics
text & video available from the
NVAC
Visual
Analytics: Why Now?
James J. Thomas, NVAC
Why
Knowledge Visualization?
Visual-Literacy.org
Practitioners
& Organizations
-
NVAC, Natl Visualization & Analytics Center
-
IEEE Visualization & Computer Graphics
-
Gapminder-visualizing human development
- IBM's
Many Eyes - Social Networking for Visualizers
- iCharts
- Infovis.net
- InfoVis
Wiki -
Visual Complexity
- interdisciplines:
adaptation & representation
- Image & Meaning,
Harvard's Initiative in Innovative
Computing (IIC) Envisioning
Science Program
- LBNL, Lawrence
Berkeley Natl Laboratory
Visualization Group
- NECSI, New England Complex
Systems
Institute, Interactive and Visual Representations
- NYAS, The New York Academy of Sciences
Visual
Arts & the Brain
Imaging
Related e-Briefings
- National
Science Foundation
Science
& Engnrg Visualization
Challenge
Video
of award winning visualizations
(Music
lovers may skip to minute: 20)
- SciDAC, Scientific
Discovery thru Adv.
Computing - Visualization & Data Mgmt
- PIIM, Parsons Institute for
Information Mapping &
PJIM,
Parson's Journal for Information Mapping
- Alice.org
- Ben Fry
- Colin Ware
-
Edward Tufte
- Felice Frankel
BOOKS
THAT OPEN OUR EYES
In
the Mind's Eye:Visual Thinkers,Gifted People
With Dyslexia and Other Learning Difficulties,
Computer Images and the Ironies of Creativity
by Thomas G. West
Krome Barratt, Logic & Design in Art, Science & Mathematics
Gy�rgy Doczi, The Power of Limits, Proportional Harmonics
in Nature, Art, And Architecture
Being
Digital, by Nicholas
Negroponte

Design
and the Elastic Mind
Suggestions
for inclusion on this page are welcome
|
|
Business
Analytics
Overviews
and Updates:
-Stephen Few's
site, Perceptual Edge
-UC Berkeley VisualizationLab,
N.B.
...Collaborative
Visual Analytics
...sense.us
(Economists, take note!)
-Visualization
Taxonomies of Visualization Tools
Commercial
Visualization Products & Companies:
-
Tableau
- Eye-sys
-
inxight's TableLens™
- Oculus
Tech & white
paper
- Palantir Technologies
- Prefuse Information
Visualization Toolkit
-
Spotfire
- Space Syntax
- TheBrain.com -
for two examples visit
+
Ray Kurzweil's site and
+
James Burke's The Knowledge Web
Podcast
Part 1
Part 2 - Just Highlights
Help on Using Spreadsheets for Visualization:
- Contact Liz Webbink
at inkweb
-
Peltier Charting Tips
- Mr. Excel's Daily Podcasts
-
Dick Kusleika's Daily Dose of Excel
- Data
Visualization from ProcessTrends.com
- Rummler Brache Chart Example
- DuPont Chart Example
-
Financial Spreadsheets
Course Materials Online (no
fee/open access)
-
MIT: Scientific Visualization across Disciplines
- Georgia Tech: Visual
Analytics Digital Library &
Software
Visualization Page
-
Stanford: Pat Hanrahan's Visualization Course
-
Columbia: Barbara Tversky: The Art & Science
of Visual Communication
- Brown U. Andy Van Dam's Computer Graphics
- Rice U: Connexions,
e.g.
Education for the New Millenium
- The Charlotte
Visualization Center at UNCC
+
Visual Analytics
+
Introduction to Computer Graphics
+ Information Visualization Techniques for Exploring Large Databases
- Visual-Literacy.org:
VizBiz
BUILDING
CRITICAL THINKING SKILLS
Psychology
of Intelligence Analysis, Richards J. Heuer, Jr., Center for
the Study of Intelligence, CIA, 1999.
For
a concise, but detailed checklist on "How to Think Critically" see
Roger Darlington's website
The
Critical Thinking Community
Gelder,
T.J. Enhancing and Augmenting Human Reasoning (pdf file).
Paper presented at Cognition, Evolution and Rationality: Cognitive
Science for the 21st Century. Oporto, September 2002. To appear
in a volume based on that conference edited by Antonio Jose Teiga
Zilhao
Excerpt
from Mindtools: Affording Multiple Knowledge Representations
for Learning, David H. Jonassen, Chad S. Carr, Pennsylvania
State University
Computers
as Mindtools for Engaging Learners in Critical Thinking, David
H. Jonassen, Chad S. Carr, Hsiu-Ping Yueh, TechTrends,
v43 n2 p24-32 Mar 1998
.INSPIRATION
FOR WEB SITE DESIGN

2006 Webby Award
Winner-Jonathan Yuen
Best Design Aesthetic
See also:
Annual Webby Awards Gallery
Experimental
Media & Movement Arts (EMMA)
|